How to integrate custom logs with Elastic Agent
From zero to hero with Elastic Agent, data streams and ingest pipelines

Fleet and Elastic Agent are both Generally Available since the release of the Elastic Stack 7.14.
Elastic Agent is a single and unified way to add integrations to the Elastic Stack. In other words, installing the Elastic Agent on a server will allow us to add monitoring for logs, metrics and all kinds of data from this host. It is also the entry point to manage security on our host through the Endpoint Security integration.
Fleet provides a UI in Kibana that will help us to enroll and centrally manage all of our Elastic Agents.
Note : Each screen capture have been made on a Kibana 8.1, all documentation URLs are 8.1 as well.
Update : Since the 8.4 version, Elastic Integrations allow you to define a custom pipeline, which is simpler that the method I describe below (in the Integration settings section). I will also put a note where it brings changes.
Before Elastic Agent, collecting custom logs (from one of our own applications for instance) required to use a Filebeat instance to harvest the source files and send the log lines to an Elasticsearch cluster. We could also define an ingest pipeline to process the raw lines and then extract the needed information.
Now, Elastic Agent gives us the ability to define a Custom Logs integration.
It will allow us to :
- seamlessly integrate our application logs the same way than the other available log integrations
- choose the name of our logs location
- define a specific
ingest pipelineto process our logs before they get imported in Elasticsearch - define the
ILMpolicy that will help us managing this data
Basics of logs integration in Elastic Stack
Data streams
Elasticsearch data stream concept is the result of what users have been used to do with index templates, aliases, the alias write index and ILM.
Basically, they are intended to be used for Time Series and they offer you a single named resource to write and read your data.
They are backed up by hidden and auto generated indices.
Two requirements to create a data stream :
- a matching index template should exist
- the documents stored in the data stream must contain a
@timestampfield
Data streams are used by the Elastic Agent for all available integrations.
Elastic Common Schema
ECS is an open source specification defining a naming convention for a set of fields to be used when storing data in Elasticsearch.
There is already a lot of defined fields, whether you want to store IP adresses or host names, log levels or country names.
Using ECS for your custom logs will ensure that your data are “speaking the same language” that your other ones. There are multiple benefits to this :
- People reading your data will be “at home” because they already know the fields
- You can query data from different sources but as they are using the same fields naming convention, it will be a lot easier to correlate them
ILM
Index Lifecyle Management has been around for some time now : you can configure a policy to drive Elasticsearch and let it automatically manage your indices according to your performance, resiliency and retention requirements.
The data
The purpose of this post is not to parse, analyze and integrate ultra complex data 🤯 so let’s keep it simple !
We will work with a simple file named example.log which contains plain text logs, for instance :
2022-03-11T10:59:03 WARN Hello I'm the line number 1
2022-03-11T11:02:34 DEBUG Well I'm the number 2
and I'm multiline !
Ok we added a little complexity by introducing multiline logs, but it will allow us to show you how you can handle this.
Elastic Agent installation
Here we suppose that our Elastic Stack is already set up and especially that we have at least a Fleet server.
Elastic Agent installation depends on the target host, so please refer to the documentation on how to install Fleet managed Elastic Agent.
Before proceeding with the installation, we will have to create a specific Agent policy that will help us to define the integrations we want to associate with this new agent.
So let’s go ahead to the Fleet screen, choose the Agent policies and create the new policy.

Once the policy is created, we can switch to the Enrollment Tokens tab to display and copy the token associated with this policy.

It will allows us to finalize the Elastic Agent installation and directly bind it with the right policy.
elastic-agent install --url=<elastic_url> --enrollment-token=<token>
Again we have to check the documentation to use the specific command line for our OS.
Now on our Agents tab, we should see our agent up, healthy and associated with our policy.
Ingest pipeline creation
Note : since Elastic 8.4, you will not need to create your ingest pipeline from scratch, but rather customize the one that is directly proposed through the Integration UI (cf. capture below).

Ingesting custom logs means that we have to process the raw data ourselves. Ingest pipelines are the way to go ! Let’s see how we can use Kibana to create and test a pipeline.
For a reminder, here are the typical data we want to process :
2022-03-11T10:59:03 WARN Hello I'm the line number 1We have first a date value, then a log level and finally a message.
So let’s go to Kibana and find our way to the Ingest Pipeline management UI (Stack Management > Ingest Pipelines).
Create an ingest pipeline named custom-logs-pipeline and add two processors :
- a
dissectprocessor that will extract field values from a raw line. The pattern will be :%{timestamp} %{log.level} %{message} - a
dateprocessor will interpret the content of the@timestampfield (which is a string for now) and replace it with a real date typed value


Ingest Pipelines management UI now allows us to test our pipeline with sample documents.

The floating window that appears when we click on the Add documents button allows us to define one or more documents to test the pipeline.

Running the pipeline will show us the result and allows us to verify that our ingest pipeline correctly extracts data from our logs.
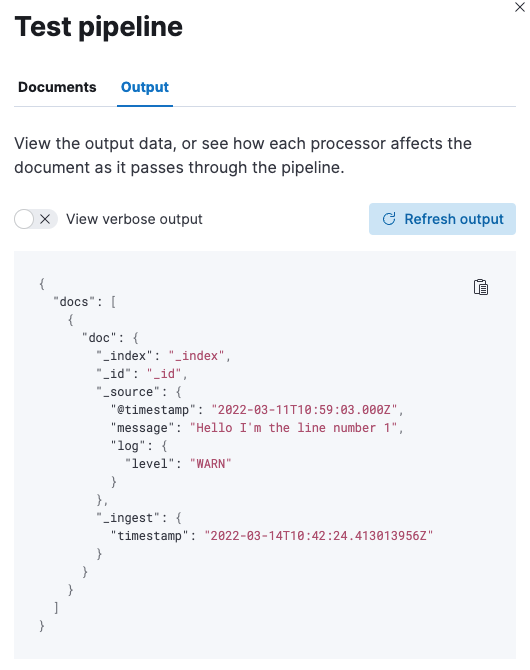
Also please note here that our resulting documents are compliant with the Elastic Common Schema ! 🙌
ILM policy
Even if some default policies already exist on Elastic Stack, it’s a good practice to define our own policy so that we can adjust it to our need, in terms of performance, scalability or retention.
Kibana allows us to create such a policy using the Stack Management > Index Lifecyle Policies menu.
Let’s say we create an ILM policy named custom-logs-policy (here we do not go into the details of creating it) but its name is important for the index template we will define below.
Data stream
Index template
Index templates have been revamped since the version 7.8 and are now composable : you can create component templates that you can reuse across several index templates.
This Elasticsearch feature allows you to define a template for any index whose name is matching a specific pattern. The magic happens when you index a document in a non existing index : Elasticsearch will create it automatically and will apply the matching template. Note that the name of the created index can match patterns from several index templates : the one with the highest priority (which is a setting of a template) will be applied.
Data streams are set up using an index template that is “data stream enabled”.
Let’s move forward and create the data stream that will store our custom logs.
Create the mapping component template
Using Kibana, go to Stack Management > Index Management, click on the “Component Templates” tab and create a new Component template.
We will call it custom-logs@mapping and define a @timestamp field as a date, a log field as an object, having a keywordsub-property named level and finally a match_only_textfield named message (Remember, ECS ! 💪)
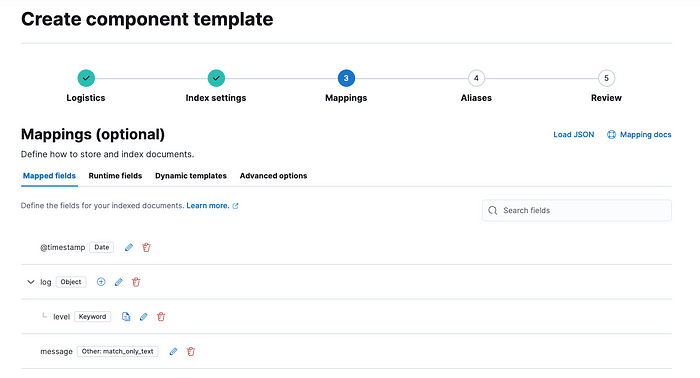
Once the mapping is created, we can proceed to the last step and save our component template.
Create the index template
From now, creating the index template is straight forward. You have to reach the “Index Templates” tab of the “Index Management” screen and click the “Create Template” button.
Let’s name this index template custom-logs-template and indicate that it must be applied to every indices starting with logs-custom-test. Very important is to set the index template priority to a number greater than 100 (which is the priority of the built-in index templates) to be sure that no pre-existing template will be selected rather than this one. Finally we enable this index template for data stream.

On the next step, we choose to use the custom-logs@mapping component template.

Now on the “Index settings” side, we indicate that we want to manage the backing indices of this data stream with the custom-logs-policy created earlier.

From now on, we can go to the final step and save the index template. The data stream logs-custom-example will be created as soon as the Elastic Agent tries to use it to index a document.
Now the goal : add the Custom Logs integration !

It’s time to add the Custom Logs integration to our Elastic Agent policy.
Go to our “Fleet” management screen and click to edit the policy that is associated with your Elastic Agent.

On the policy editing screen, we can click “Add integration” and choose the Custom Logs.

That leads us to a screen showing an overview of this integration as well as other useful informations (for instance, which policies are using this kind of integration).
We can then click the “Add custom logs” button to go to the screen where we will be able to fully configure our integration.
Let’s focus on the first part of the settings.

There are 3 settings here (which are common to all integrations) :
- The integration name
- The integration description
- The integration namespace : this one is very important for it will drive the name of the data stream used to store the documents, see the corresponding documentation.
Now let’s see the second part of the settings.

Again, we have 3 settings here :
- This is the path to the file we want to integrate (here we assume that the file is located at
/etc/var/logs/example.log). Note that this setting can be an expression (with wildcards) and that we can add as many paths as we want. - The data set name is as important as the previous
namespacesetting and will also be part of the data stream name. In the end, the destination data stream will belogs-custom-test(which is great because this is precisely the one we created earlier 🤘) - Finally, the “Custom configurations” panel allows us to set the
ingest pipelinewe want to use to process our logs (if you are using Elastic v8.4+, you probably have used the custom ingest pipeline as described at the beginning of this section, so you do not need to use this settings) and a configuration that will enable the management of the multiline logs (basically, it will merge lines that do not start with a date to the previous one — see the filebeat documentation)
Finally we have to set on which policy we want to add this integration (here we choose “Existing hosts”).

And save the whole integration.

Conclusion
And there we are ! 🎉
Our logs are correctly read, they are indexed in a data stream named logs-custom-test and they are available to consult via the discover screen of Kibana, using the logs-* data view (which is actually the new name of Kibana’s index patterns).
Hope that this step by step guide was helpful for you to build your own Custom logs integration !
👋
Note : At the moment of writing, a new filestream integration is reviewed and will take advantage of this new Filebeat input (see this Github issue), looking forward to this !
Note 2 : This article has been updated on 2023/12/15 to mention the custom pipeline that is available since Elastic V8.4