Exploring the Network Tab in Chrome Dev Tools
Learn how to measure web app performance using the Network Tab in Chrome Dev Tools
Chrome Dev Tools is one of the vital tools when it comes to web development. It is equipped with a large number of features for us to take advantage of. In this article, I will be focusing on using the Network Tab in Chrome Dev Tools to analyze web app performance.
First of all, you might wonder what’s the benchmark to measure performance. If you ask from Google, you will find;
“Two seconds is the threshold for eCommerce website acceptability. At Google, we aim for under a half-second.”
Starting with the Performance Analysis
Let me start with the most obvious starting point to start recording all the requests sent by your browser upon loading the app. I hope you already know that the Network Recording begins as soon as the Network Tab is opened by default.

At any point, you can click on the red button to stop recording, and then you can inspect the size of the content that got loaded, how many requests were sent, how much data were transferred up to that time frame, etc. These details are useful to further drill down into request level performance analysis.
However, I’m mostly interested in what’s at the end of the recording, the aggregated results.

But how can I use these data to get a measurement of the web app performance?
In a modern web app, you will find the browser downloading the files, parses them, and use JavaScript to render the UI components. One of the challenges here to identify the point you consider your web app is ready.
Let’s consider the point when the user has a minimal version of the web app loaded to interact as the first contact point.
So, you might wonder which parameter should I select out of Finish, DOMContentLoaded, or Load time for the measurement?
This is the hardest part. You won’t be able to find a single answer. To find the right solution for your application, let’s understand these measurements at first.
DOMContentLoaded: (HTML + BLOCKING JAVASCRIPTS ONLY)
This event is fired when the browser downloads and parses the HTML document and any synchronous JavaScript files <script src="my.js"></script>. However, if you use async JavaScript files (e.g.: <script src="my.js" async></script>), these files load after the DOMContentLoaded event is fired.
Load: (HTML + ALL BLOCKING)
The Load event is fired after the page is fully loaded along with any Blocking Resources. Here, the blocking resources are synchronous JavaScript and CSS files.
Finished: (HTML + BLOCKING + NON BLOCKING)
The Finished event is fired after the HTML + BLOCKING + NON BLOCKING resources (Including all the XMLHttpRequest() requests) are loaded in the browser.
Typically you will likely find the first contact point between Load and Finished.
If your landing page doesn’t require XMLHttpRequest() to load data, the first contact point will happen slightly earlier and fall between DOMContentLoaded and Load. Therefore, depending on your web app implementation, you need to select the right matrices to calculate the first contact point.
Tip: Share your reusable components between projects using Bit (Github). Bit makes it simple to share, document, and organize independent components from any project.
Use it to maximize code reuse, collaborate on independent components, and build apps that scale.
Bit supports Node, TypeScript, React, Vue, Angular, and more.

Network throttling to benchmark performance
Compared to a mobile user, the computer you use to develop your website may have a better internet connection. So, sometimes you may forget to consider page load time for users with a low network speed.
The Network Throttling function allows you to see what a mobile user will experience. You can change the settings in the Throttling dropdown from “Online” to “Fast 3G”, “Slow 3G,” or “Offline.”
Typically I use Regular 4G (Regular 4G, download-4000kb/s, upload-3000kb/s,RTT-20ms) for web apps device testing.
But it's completely up to you to decide the compatible devices depending on your application user base.
However, you won’t be able to find the 4G option in the default throttling list in Chrome. Therefore, you might need to create a Custom Network Throttling Profile with 4G parameters to simulate the network.
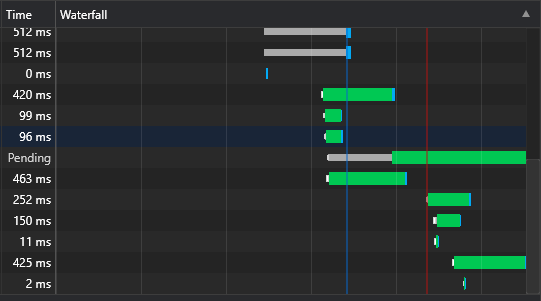
Waterfall Graph, What does it Say?

The visualization of network activity for each resource is shown in the Waterfall column. It allows you to compare the timing of resources.
When measuring the individual API endpoint performance, I typically filter out only the XHRs (XMLHttpRequests) and determine HTTP requests’ duration.
Importance of Timing breakdown
When inspecting the Queueing durations in the Timing breakdown, you can identify the high priority requests. That will allow you to fine-tune your web app by removing unwanted requests from the queue. A request can be queued due to some other reasons as well.
If there are more than 6 TCP connections already opened, the next request could be queued(in HTTP/1.0 and HTTP/1.1 only).
Also, if the browser is allocating memory in the cache, the requests could be queued. By inspecting the Timing breakdown, you can control request queueing.
Apart from that, the timing breakdown gives more exciting information on time spent on DNS lookup, Proxy negotiation, Initial connection, SSL, Content Download, etc. You can quickly inspect these variables and decide on what slows down your web app performance.
Parallel Network Requests and their implications
You can quickly identify parallel network requests by inspecting the waterfall graph. Even though parallel network requests make your page load faster and make maximum use of dead time and bandwidth limit, it is not always fast.
When the network bandwidth is low, all the parallel requests will try to compete with each other, which will finally lead to lower performance in your web app. Therefore, browsers limit simultaneous network requests (usually up to 4).
But how do browsers prioritize requests? HTTP/2 clients can control the transmission order of resources by priority. Priority is being showcased by dependency and weight. And the versions above Chrome 46 give the highest priority to the main resource, CSS (match), Font, etc.
Performance of the app without caching
Caching in web browsers allows fast loading of the web pages. But it doesn’t mean it is the real performance of your application. The Disable cache checkbox will allow you to observe your web app’s behavior when there is no cached memory.
For example, we can say it shows how your web app performs for a brand new visitor to your website.
Identify which responses are not compressed
Furthermore, you will be able to view more information about each source by heading over to the gear icon and ticking “Use large request rows.” You can make sure that resources are compressed by analyzing the Size column. The first value gives the uncompressed size, and the second value gives a compressed size.
If both values are equal, that means the compression does not function properly, or your server is not configured for compression.
Final Thoughts
While there is a dedicated tab in Chrome Dev Tools to analyze your web app performance, there are many measurements you need to take to find the right value for your web app.
However, in this article, I have only talked about measuring the web app’s average load performance. If you plan to test the application under stress, you might need to go beyond Chrome Dev Tools and select load testing tools such as JMeter. But, that’s a whole new topic to cover for a different article.
I hope the areas mentioned above will come in handy for you to understand your web app’s network performance better. If you follow different mechanisms using Chrome Dev Tools for web app performance testing, let me know the comments below.
Thanks for reading !!